Finally, a Map That Shows Solar Energy Sites Worldwide
Page Contents
Written by qualified solar engineer Aniket. Last updated:
For the first time, we have access to a globally open dataset of solar power sites worldwide. Four researchers from the University of Southampton published a report in the Nature journal and have worked on the ‘Harmonised global datasets of wind and solar farm locations and power’ article.
According to the authors, this vast information will help global land planners to make informed decisions while allotting resources to renewable energy projects.
Currently, the considerations in the decisions of new projects include land suitability, along with technical and socio-economic constraints. Although this has generally seemed sufficient, the researchers argue that these are insufficient indicators and the mapping will address this shortcoming.
Implications of a Global Solar Map
In just a decade, solar energy has grown exponentially. Without a doubt, this has ushered in a promise of a cleaner future and slashed energy costs worldwide. However, as new solar power plants that cover hundreds of acres come up every few months, experts are becoming increasingly interested in how multiple aspects of the society are affected.

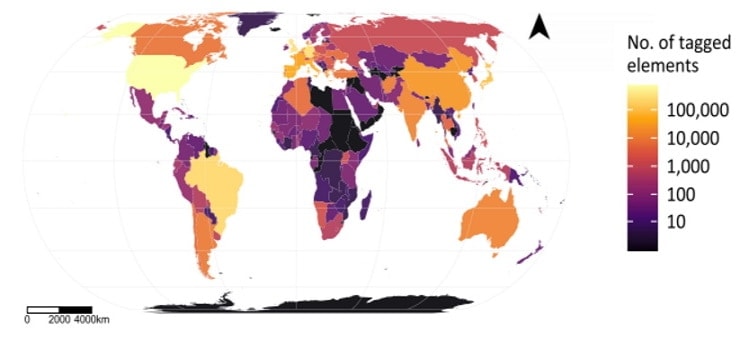
Distribution of Solar Power Plants Worldwide (Source – Nature)
As solar and wind energy become mainstream and require vast land areas, more questions will be raised about the biodiversity loss that may occur, in comparison with fossil-based energy. So far, there hasn’t been a global dataset to find metrics on such questions – this study might hold the key to solve it.
According to the researchers at Southampton, “Sufficient location data would allow researchers to interrogate the socioeconomic drivers of renewable energy infrastructure siting at a global scale to produce probability surfaces for energy development”.
Similarly, according to the members of this project, a recent study suggested that small-scale deployment of solar energy led to lower biodiversity loss as compared to large-scale deployment. Although solar has proved to be far less harmful to the environment than its fossil-based counterparts, it is important to know which type of solar deployment is better. This global mapping technology will prove to be a crucial tool in determining such values.
How They Did It
Technically, it would be very difficult and complex to locate each solar or wind energy plant in the world through methods which do not involve satellite mapping. An important highlight of the project is its use of the free OpenStreetMap (OSM) platform. OSM includes map data built using contribution from millions of users.
The goal was to include accurate search values to have consistent and precise data extraction. Think of this as describing an animal on a search engine so that the engine can return the maximum amount of correct information related to that animal. For this, they used an existing database and randomly selected 50 solar plants and 50 wind sites worldwide. Specific keys and values were attached to this test dataset.
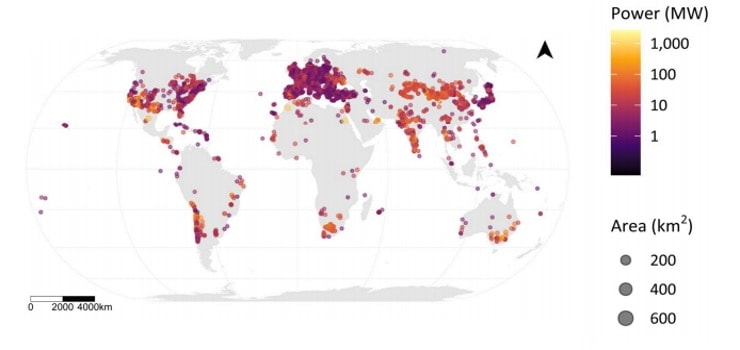
Mapping the number of plants worldwide was only the first step of the project. It was equally important to map the sizes of projects. For instance, a solar plant might be at the installed capacity of 100MW and another could be more than a GW. Their socio-economic and environmental effects will be hugely different. For this, they used areas of polygons (sites) to derive installed capacity information, among other more complex factors.

The Global Distribution of Solar and Wind Installations (Source – Nature)
Applications of the Data
The mapped data can be used for the following purposes, as per the developers:
- Analyzing the land impact of current infrastructure
- Measuring progress towards global goals
- Informing future energy planning scenarios
Of course, this data can prove to be instrumental in many other ways, of which we will find out as time progresses and solar energy becomes more common.
References
- Solar and wind energy sites mapped globally for the first time – University of Southampton
- World Solar Database – Wiki Solar
We hope you liked this article. Please rate it or leave us a comment.
Average rating 4.3 / 5. Vote count: 4
No votes so far! Be the first to rate this post.


